Pages

Showing posts with label conversion. Show all posts

Tuesday, December 9, 2014

A What-Not-To-Do Case Study

Our assignment this week asked us to research a company and report of their analytics efforts. I am choosing to keep the organization I researched private, but will report my findings nonetheless.

The organization I chose has no brick-and-mortar presence, but sells a wealth of products online via its website. The company uses two different tools for website analytics: Webtrends and Google Analytics. Webtrends was implemented by the IT department as the primary analytics tool. Ownership of the website resides in the sales department and focuses on business goals at the 30,000-foot perspective. Below are two examples of the monthly Webtrends reports that the website owner submits to executive management to illustrate website success.


This report focuses on very basic website statistics such as visits, page views, visit duration, bounce rate, visitor location (domestic or international) and new or returning visitors. It highlights three months of statistics.  This report does not provide information about website sales, traffic patterns, popular pages, or referral traffic.

This second report focuses on website traffic by region.  Unfortunately, it does not delve into the behaviors, purchase or traffic patterns, or additional demographic or psychographics of these visitors.


These reports appear to have been developed using Webtrends by the website owner, but offer little in terms of actionable data.  Below is another example of a customized Webtrends report developed by the website owner. This report shows one of the sales funnels, which have been set up for some of the business lines (books, collections, membership, paid video, papers, standards, and training/education). At first glance, these reports appear to have the potential to be very useful. Until you look closer. Notice that the number goes UP between the third and fourth steps of the funnel.  Clearly, these funnels are not set up properly, or there are issues with the purchase path itself. If this could be remedied, these sales funnels would allow SAE to determine where people are abandoning the purchase process and evaluate those steps/pages and make adjustments to improve conversions.  However, there is one additional issues with the way these funnels are set up. There is no way to determine where traffic originates from, so even if the funnel and/or purchase path issue were to be resolved, this data would still be lacking some key information.

So, Google Analytics was implemented at the request of the marketing department in an effort to better capture data related to marketing efforts. With Google Analytics, traffic from online advertising campaigns can be tracked. 

There are a number of ways that this organization could improve website analytics efforts. Correcting the Webtrends sales funnel reports would be a significant improvement, which would allow the organization to evaluate where and why people are abandoning their purchase part way through the process and make adjustments.

Another big improvement would be to add options for segmentation of sales funnel conversions. Segmenting by referral traffic would provide an opportunity to evaluate each traffic source separately and determine which channels are converting to sales, and which are not. Segmenting by location would allow the organization to evaluate the effectiveness of regional promotional efforts related to organizational goals.

It would be helpful to produce reports detailing sales and other conversions from the website so that executives, and the rest of the staff, can see how marketing and sales efforts are converting month-over-month, and year-over-year.

Finally, it would be useful to set up conversion tracking, via Google Analytics and/or Webtrends, to understand customer engagement beyond the exchange of money. Since many products this organization sells have high price tags and require commitment at the enterprise level, it would be very useful to track other conversions that can ultimately lead to an eventual sale.

Sunday, November 2, 2014

Raising Conversions Rates

Websites are created to educate audiences and drive action. According to website analytics expert Avinash Kaushik, “Life is about taking action, and if your work is not driving action, you need to stop and reboot” (2009). The key to determining whether or not customers are taking the actions you are hoping they take is to keep an eye on conversion rates.

There are two ways to define conversion rates. One way is to measure outcomes divided by unique visitors (or separate individuals). Using this method indicates that it is acceptable that a visitor may visit your website repeatedly for research before making a commitment (Kaushik, 2009). Another way is to measure outcomes divided by unique visits. By committing to the latter, you are presuming that each and every unique visit is the opportunity for conversion (Kaushik, 2009). The method you choose to use to measure should depend on your business model.

Outcomes could refer to any number of events. Some examples include subscribing to an RSS feed, signing up for an e-newsletter, download a white paper, registering for a webinar or event, commenting on a blog post, sharing content, or completing a sale.

Comparing your conversion rates to other organizations can be dangerous because, as noted above, conversion rates can be measured differently. It’s best to compare your current conversion rates to your past rates. As Forbes contributor Dave Lavinsky said, “No matter how good your current conversion rates are, they can always get better.”

The KISSMetrics blog highlights a number of ways that companies can test out strategies to improve conversion rates. Below are a few of the easiest ways to improve conversion rates.

This first example highlights the value of testing different text in order to see which headlines and body copy drive the most conversions. In order to determine which variable is causing a change (increase or decrease) in the conversion rate, you need to be sure to only test one variable at a time. In the first example, the brand L’Axelle uses the phrase “Feel fresh without sweat marks,” which is a comfort-driven statement.  In the second image, L’Axelle uses “Put an end to sweat marks!”  This statement is driven by the problem and includes an exclamation point.


As you can see, the ONLY change made to the webpage was the headline.  And the action-driven headline increased conversions by 93% to a total of 33.8%.

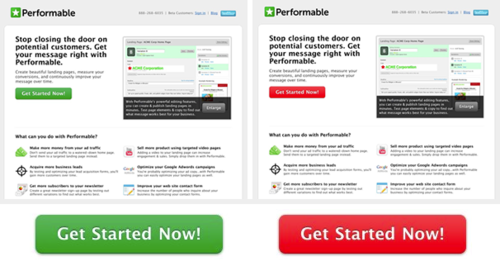
Another change that is relatively easy to test is color.  Something as simple as change the color of a call-to-action button can improve the conversion rate.  Here’s an example from HubSpot that shows what a change of color can do.


The call-to-action on the button stayed the same, as did the page design and body content.  The only change was the color of the button from green to red. The assumption was that the green button would convert better because it indicates “go,” or forward movement, while the color red is typically associated with “stop,” or warning. The red button outperformed the green button by 21%.
There are many more complex ways to improve conversion rates for different outcomes on your website, but two easy ways to complete A/B testing with headlines and button colors.  This A/B testing will provide concrete evidence as to which specific elements will increase conversions. 


Offline Reference
Kaushik, A. (2009). Web Analytics 2.0: The Art of Online Accountability and Science of Customer Centricity. Wiley. Kindle Edition.